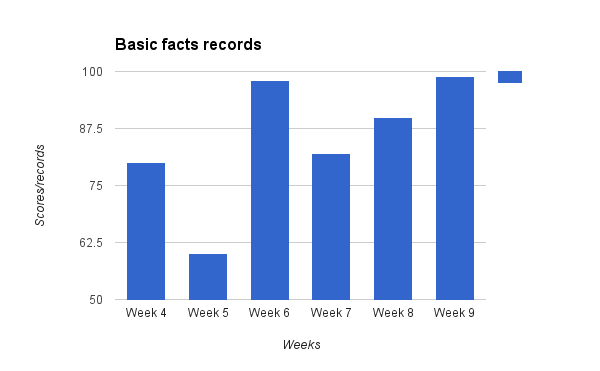
Evaluation:This graph shows the progress the student has made across 6 weeks. The axis labels help the reader to understand what was measured and when.
WALHT: Use spreadsheet to enter and display data.
WALHT: Analyse and discuss data displays.
WALHT: Analyse and discuss data displays.
No comments:
Post a Comment
Note: only a member of this blog may post a comment.